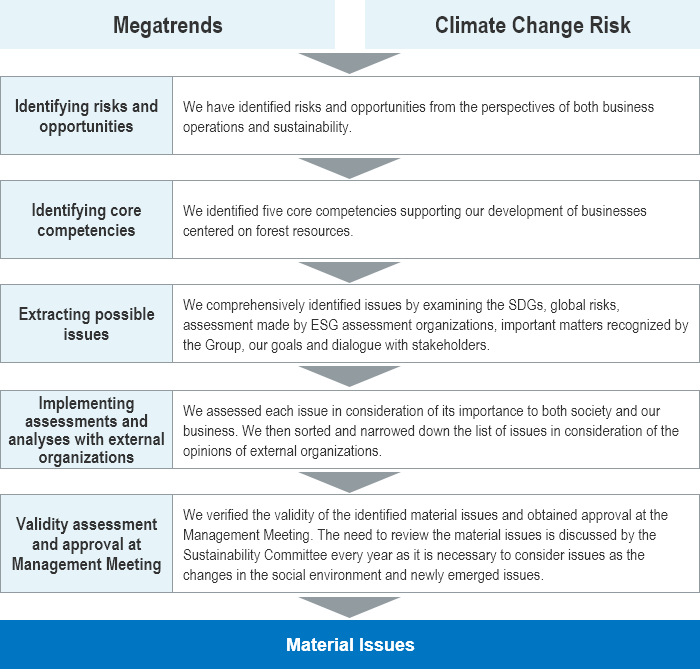
Process for Identifying Material Issues
Taking into consideration ever-changing social trends, the Oji Group identified opportunities and risks associated with its business as well as material issues utilizing the following process in 2019.
In 2023, we took steps to renew our definitions for and the components of material issues and revised the KPIs for enhancing human capital. More recently in 2024, we added KPIs regarding biodiversity conservation.
Material Issues: Definitions and KPIs
- Mitigation and adaptation to climate change
- Sustainable forest management and biodiversity conservation
- Circular use of resources
- Responsible raw materials procurement
- Reduction of environmental burdens
- Respect for human rights
- Enhancing human resources
- Ensuring workplace safety and health
- Supply of safe and secure products
 Mitigation and adaptation to climate change
Contribute to the mitigation of climate change by reducing GHG emissions throughout the supply chain and facilitating forests’ absorption and storage of CO2.
| Components | KPIs (Key Performance Indicators) (FY2030 unless otherwise noted) |
Current Values*1 | Value Provided to Society | Corresponding SDGs |
|---|---|---|---|---|
|
|
|
|
7.2, 7.3, 7.a 9.4, 9.5 12.2 13.1, 13.2, 13.3 |
|
|
|||
|
|
|||
|
|
|||
|
|
 Sustainable forest management and biodiversity conservation
Practice sustainable forest management in harmony with the environment and local communities in the forests we own and manage, utilize forest resources and achieve multi- functional forests, which includes biodiversity conservation efforts.
| Components | KPIs (Key Performance Indicators) (FY2030 unless otherwise noted) |
Current Values*1 | Value Provided to Society | Corresponding SDGs |
|---|---|---|---|---|
|
|
|
|
6.6 8.7 14.2 15.1, 15.2, 15.3, 15.4, 15.5, 15.c |
|
|
|||
|
|
|||
|
|
|||
|
|
 Circular use of resources
Prevent resource depletion and facilitate the effective use paper and water, which we view as valuable reusable resources.
| Components | KPIs (Key Performance Indicators) (FY2030 unless otherwise noted) |
Current Values*1 | Value Provided to Society | Corresponding SDGs |
|---|---|---|---|---|
|
|
|
|
6.4, 6.5 12.4, 12.5, 12.6 14.1 15.1, 15.2, 15.3, 15.4, 15.5, 15.c |
|
|
 Responsible raw materials procurement
In the supply chain for procurement of all raw materials, we pay close attention to environmental and social issues, including human rights, and address them responsibly.
| Components | KPIs (Key Performance Indicators) (FY2030 unless otherwise noted) |
Current Values*1 | Value Provided to Society | Corresponding SDGs |
|---|---|---|---|---|
|
|
|
|
8.7 12.1, 12.4, 12.6 15.1, 15.2 |
|
|
 Reduction of environmental burdens
Reduce waste and purify wastewater and exhaust gases generated in the manufacturing process to minimize environmental impact on surrounding areas.
| Components | KPI (Key Performance Indicators) (FY2030 unless otherwise noted) |
Current Values*1 | Value Provided to Society | Corresponding SDGs |
|---|---|---|---|---|
|
|
|
|
3.9 6.1, 6.3, 6.4 11.6 14.1, 14.2, 14.3 17.7, 17.8 |
|
|
|||
|
|
 Respect for human rights
Do not tolerate the violation of human rights in any of our business activities.
| Components | KPI (Key Performance Indicators) (FY2030 unless otherwise noted) |
Current Values*1 | Value Provided to Society | Corresponding SDGs |
|---|---|---|---|---|
|
|
|
|
|
 Enhancing human resources
Secure and develop diverse the human resources that are necessary for sustainable growth. Establish an environment in which every employee can work comfortably and fully demonstrate their potential.
| Components | KPI (Key Performance Indicators) (FY2030 unless otherwise noted) |
Current Values*1 | Value Provided to Society | Corresponding SDGs |
|---|---|---|---|---|
|
|
|
|
|
|
|
|||
|
|
|||
|
|
|||
|
|
|||
|
|
 Ensuring workplace safety and health
Ensure the safety and health of all employees and people connected to our business.
| Components | KPI (Key Performance Indicators) (FY2030 unless otherwise noted) |
Current Value*1 | Value Provided to Society | Corresponding SDGs |
|---|---|---|---|---|
|
|
|
|
|
|
|
 Supply of safe and secure products
Supply safe and secure products worldwide.
| Components | KPI (Key Performance Indicators) (FY2030 unless otherwise noted) |
Current Value*1 | Value Provided to Society | Corresponding SDGs |
|---|---|---|---|---|
|
|
|
|
|
- *1 Aggregation period: Unless otherwise specified, from April 2024 to March 2025 or as of March 31, 2025 (for overseas, with some exceptions, from January to December 2024 or as of December 31, 2024). Boundary of data aggregation: Unless otherwise specified, Japanese and
overseas consolidated companies - *2 Refer to ESG Data for information on calculation methods
- *3 Suppliers in top 75% of transaction amount
- *4 Serious accidents: The Oji Group considers accidents of Class 3 or higher as per the Appended Table of the Enforcement Regulation of the Workers’ Accident Compensation Insurance Act to be serious accidents.